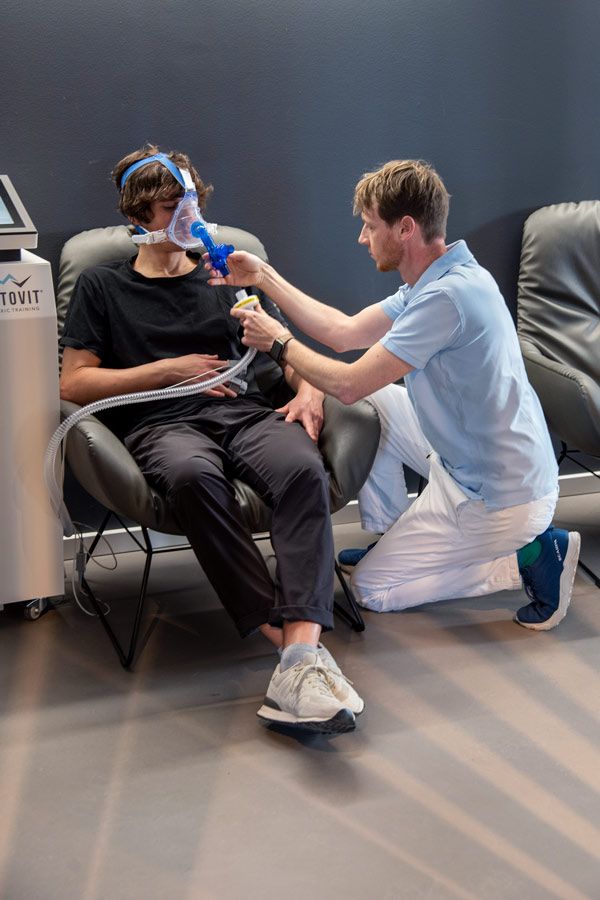
Spiroergometry
Breathing under stress: interpreting results correctly
Spiroergometry (CPET) is derived from the Latin word "spirare" (to breathe) and the Greek words "ergon" (work) and "metron" (to measure). In other words, the respiratory gases are measured under load. Stress here means testing either on a bike or on a treadmill (running or walking). This diagnostic leads to various statements about the (endurance) performance and the metabolism.


The following schematic curve can be used to explain the process and the results very well.
Rest
Before the first movement begins, the rest values are determined.
Warm-up
The warm-up phase serves on the one hand to activate the muscles, and on the other hand it releases the bound CO2 from the tissue in order to breathe it out, so that with the actual start of the test the values are unaltered.
Test
Starting loosely, the load increases until the desired limit is reached. Be it a maximum load for healthy athletes or a submaximal load due to complaints or other contraindications such as a pacemaker.
Post-load
After reaching the maximum, the intensity is adjusted back to the level of the warm-up phase and breathing, blood pressure, heart rate and emotions can return to normal.
Results
The red curve in the picture shows the heart rate. The course is explained by the different phases: Lowest at rest, slightly higher during warm-up, rising to maximum over the test and then falling again.
The blue curve corresponds to the equivalent of carbohydrate metabolism. With increasing load, carbohydrates are also increasingly needed for energy production.
The grey curve describes the fat metabolism. Interesting here is the fact that there is an optimum for fat burning, which cannot be calculated using formulas, but can only be measured.
The two vertical lines correspond to the so-called ventilatory thresholds.
VT 1 marks the end of optimal fat burning and is accompanied by a slightly increased lactate value in the body, so that the bicarbonate buffers start to work.
VT 2 roughly corresponds to the anaerobic threshold, above which the inhaled oxygen is no longer sufficient to provide the required energy and the body accumulates lactate, i.e., becomes increasingly acidic.
Another interesting value is the VO2max or VO2peak, i.e., the maximum oxygen uptake capacity. From this, among other things, the potential can be derived and also a comparison to high-performance sports can be made.
The corresponding training ranges are then derived from these curves. Depending on the goal, time investment and motivation, a corresponding training plan can be derived from the curve, which is individually designed to achieve the respective goal (e.g., immune system, fat burning, performance improvement, competition preparation).
If you want to delve deeper into the matter, you can take a look at the so-called 9-field graph, which shows all the values of the spiroergometry:
This much should be said: based on the results of the spiroergometry, you get a cardiological and pulmonological interpretation in addition to the training values. This means that the results can be used to assess risks to the heart and lungs.